Last week we added a Sage Intacct Performance Cards to our dashboard to compare this month’s sales to last month’s sales. Imagine that now we also want to add a performance card to show us our year-to-date revenue at a glace. It can be very useful to have important financial data like this easily visible when you log in, rather than buried in the reports.
In order to add a new performance card to your dashboard navigate to the dashboard list screen found at Dashboards > All > Dashboards, locate the line item for the dashboard you wish to add this new component too and click ‘View Components’. The dashboard will load. As you can see below the Performance Card we added last week is already appearing on this dashboard. In the top right corner of the dashboard click the + mark to add a new component.

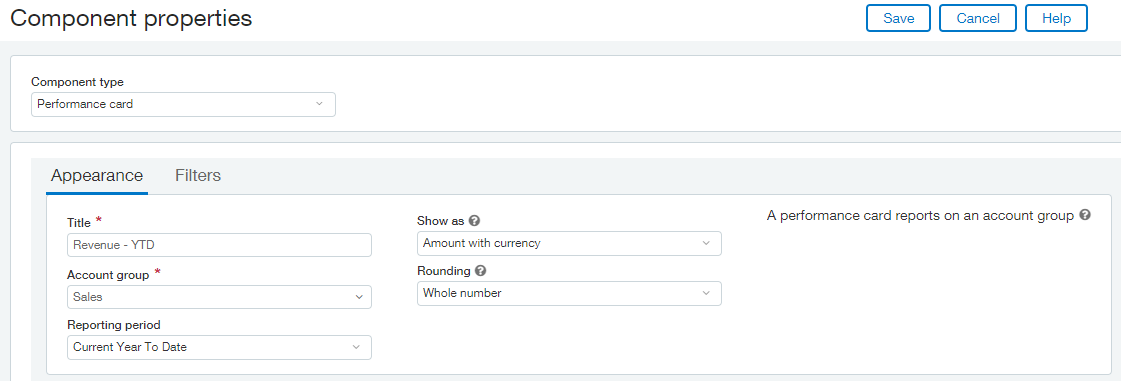
On the Component properties screen, dropdown the Component Type box and select Performance card. Once Performance card is selected you will be taken to the Appearance tab on the Component properties screen. In the title field enter a meaningful title for your performance card, our performance card will be a year-to-date revenue so it will be named ‘Revenue – YTD’. From the account group dropdown ensure you select the correct group. If the group you require is not an option there then it most likely needs to be set up. In order to do so simply open another tab of Sage Intacct and navigate to General Ledger > All > Financial report structures > Account groups and set up the group there. Please note: The account group can be made up of a single GL account or multiple, depending on how you wish to report. Once the account group is selected on your Component properties screen ensure you specify the Reporting period you wish to use (Current Year to Date), how you wish the amount to be displayed (amount with currency) and how you wish it to be rounded.

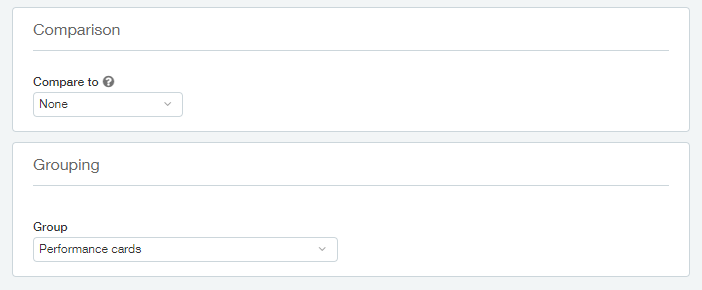
The lower portion of this screen is where you will specify the second set of data to which you will compare the first. On this Performance Card we will not be doing a comparison, we will simply be displaying the revenue amount. As such in the Compares to dropdown we will select None.
The grouping portion of the screen allows us to place components grouped together into an area on the dashboard. Having components grouped makes for easier organization on screen. Last week we created a group call ‘Performance cards’ and we will add this, our second performance card, to that same group.

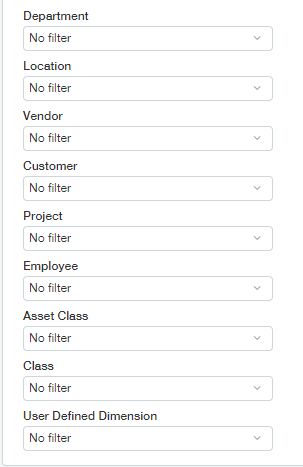
Last week we learned all about how the Filters tab works. In this case we will be showing the sales for all entities and all departments and as such we will not specify any pre-set filtering. We will leave Dashboard filtering on for greater flexibility for the user to drill down by location at run time.

Once you are satisfied with your performance card settings, click Save. Remember that these settings can be modified at any time if you wish to change them. Now preview your Dashboard in order to see your new performance card. Congratulations, you have created both a comparison performance card and one that displays a value.
