Last week we customized, previewed and memorized our custom AP Vendor Aging report in preparation for adding it to our custom Dashboard Reporting. This week we will continue and actually add this report to our dashboard.
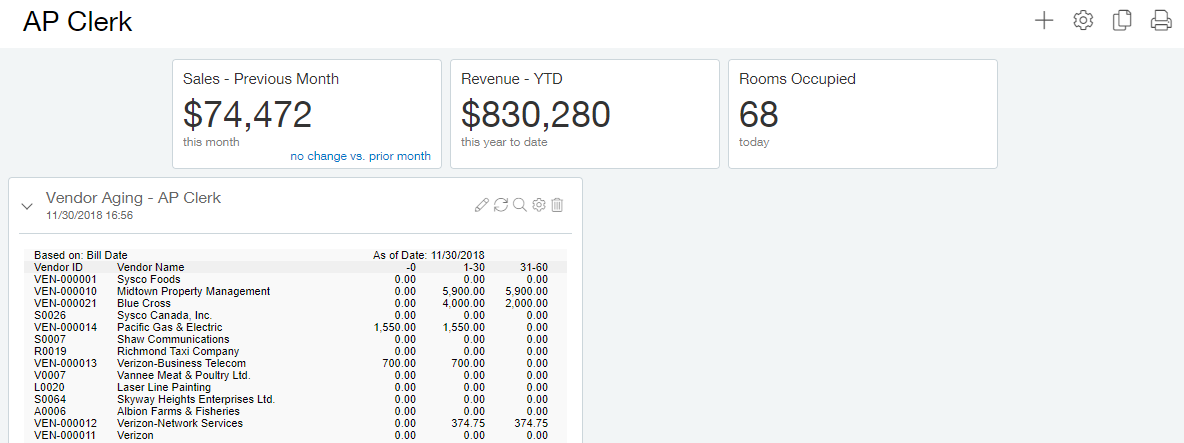
The first step to adding this AP report to a dashboard is to navigate to the dashboard list screen found at Dashboards > All > Dashboards, locate the line item for the dashboard you wish to add this new component too and click ‘View Components’. The dashboard will load. As you can see below the Performance Card we added last week is already appearing on this dashboard. In the top right corner of the dashboard click the + mark to add a new component.

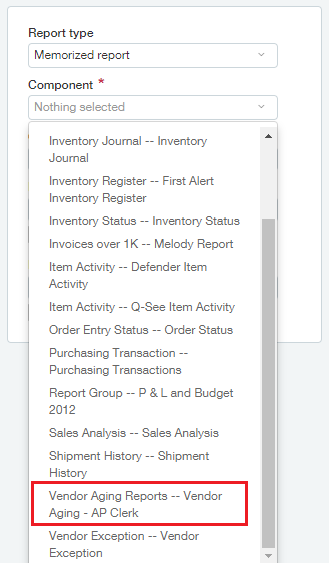
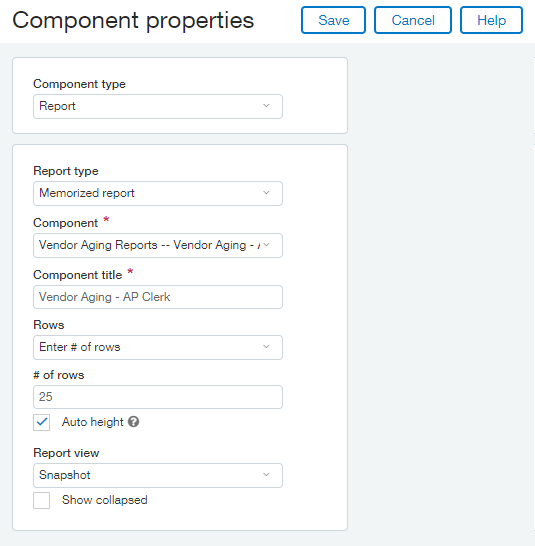
The Component Properties window will open. Select Report as your Component type and then from the Report type dropdown we will select Memorized report. The act of selecting Memorized Report makes it so that all of our memorized reports are displayed in the Component dropdown. Scroll down to locate your Memorized Report and click it to select.

If you wish to change the name displayed on your dashboard this can be done in the Component title field. Please note that this is a required field, so make there is a title specified. The next field on the form can be of great use to people with large Vendor Aging lists. In some instances you may prefer to only show a small portion of the vendors returned, in which case you will select Enter # of rows in the Rows dropdown and they specify the number of rows to display. We will choose 25 rows.
The Auto height field is where you specify whether you’d like Sage Intacct to determine the correct size for each row without requiring you to scroll vertically or if you would like to specify the height yourself. We will select Auto Height but should we wish to change our dashboard layout in the future we can most definitely change this setting. If we wanted this report to display in real time and update as changes occur, we would select a Live Report view. In our current case we are happy with simply viewing a snapshot. What it mean to select the snapshot view is that the data loaded when the dashboard loads and remains as is until the user clicks the refresh button on the component or reloads the entire dashboard.

When Show collapsed is select the component detail will be hidden when the dashboard is loaded, only the title will be shown. In order to see the data the user will have to expand the component. This is useful functionality for instances when you want the information present on the dashboard but you don’t always need to see it.
Click Save once you have completed all the fields on the Component properties screen. Your dashboard will re-load to include your new report!
