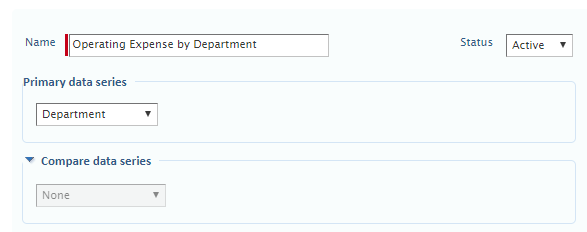
Dashboard Graphs are a quick and easy way to review data on your dashboard. The first step to adding a graph to the dashboard is to create the graph itself. In order to do so navigate to General Ledger > All > Financial Graphs and click ‘Add’. Enter the name of your graph, ours will be called ‘Operating Expenses by Department. Ensure the status is set to active and set the primary data series to ‘Department’. As we will not be doing a comparative graph we will leave the Compare Data Series field set to ‘None’.
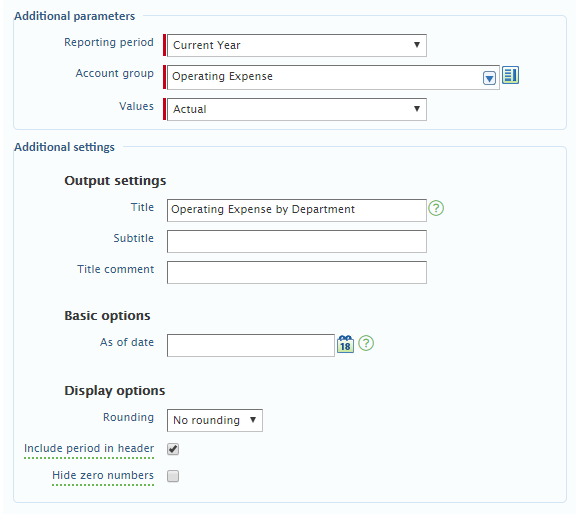
In the Additional parameters section we will set the reporting period to Current Year, set the Account group to Operating Expenses (or whatever equivalent group you have) and the Values dropdown will be set to Actual. The title can be whatever you wish it to be but in our case we chose to display ‘Operating Expenses by Department’. Since we want the data displayed to be as of today we will not set an As of Date.
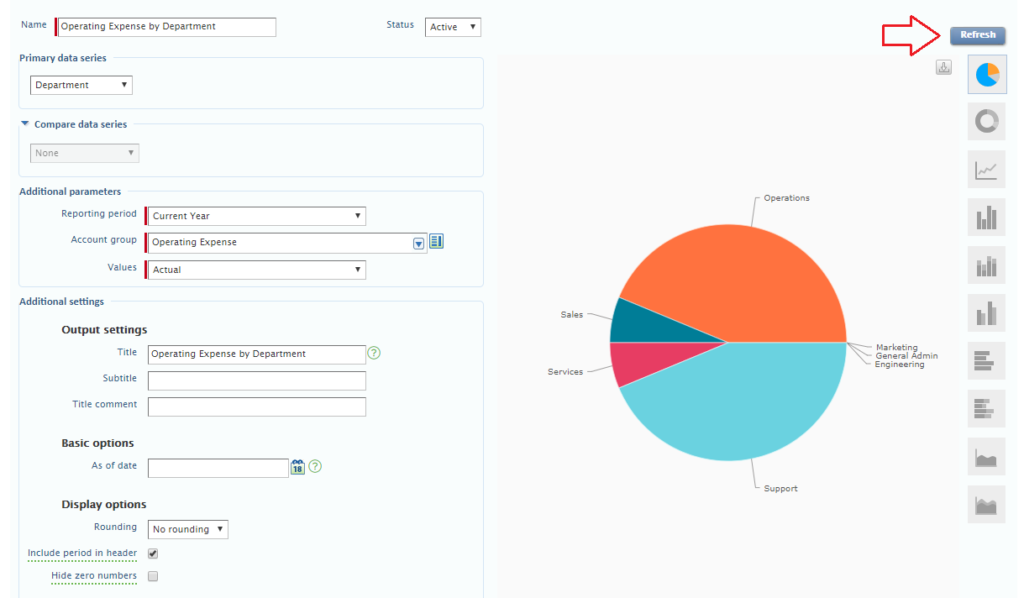
Once you are happy with the settings click the Refresh button at the top right of the screen to view your graph. You can easily change graph types by clicking the various formats below the Refresh button, but we will stick with a pie chart. Click ‘Save’ to save your graph.
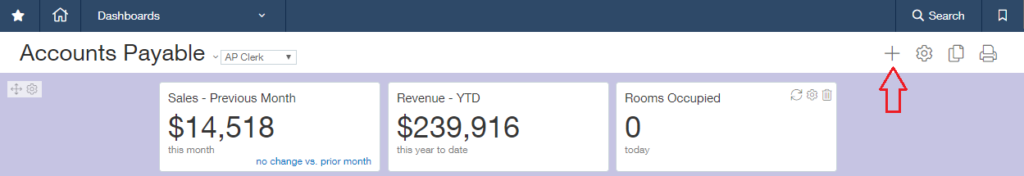
In order to add your graph to a dashboard open your dashboard and click the + mark in the top right corner.
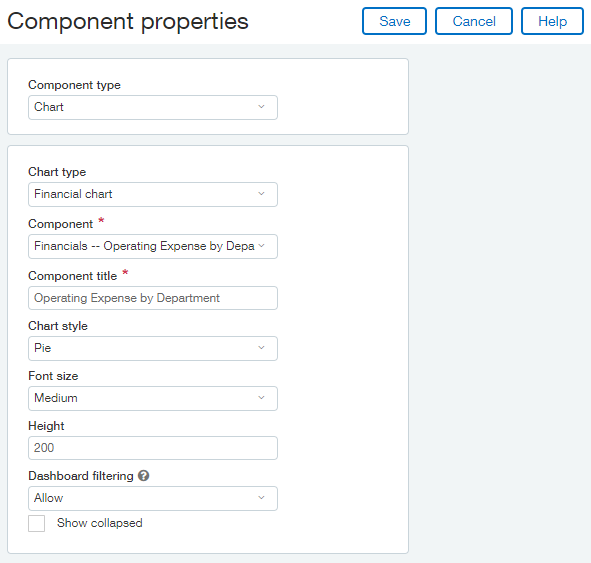
In the Component type dropdown select ‘Chart’ and then select a Chart type of ‘Financial Chart’. You should now be able to dropdown the Component field and select your report from the list. In our case the component is named ‘Financials – Operating Expense by Department’. The component title will automatically fill in for your but feel free to modify it as you see fit. The chart style is an important field to check as it may, be default, not be the type you want. In our case we chose to display a pie chart. The rest of the fields we left as default.
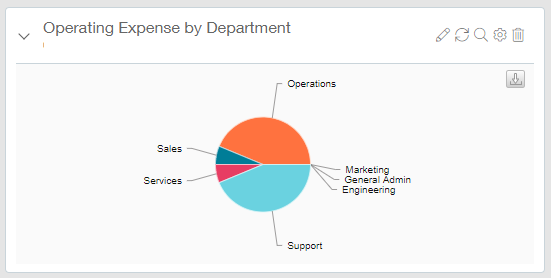
Click ‘Save’ and you will be taken back to your dashboard where your new graph is displayed!