
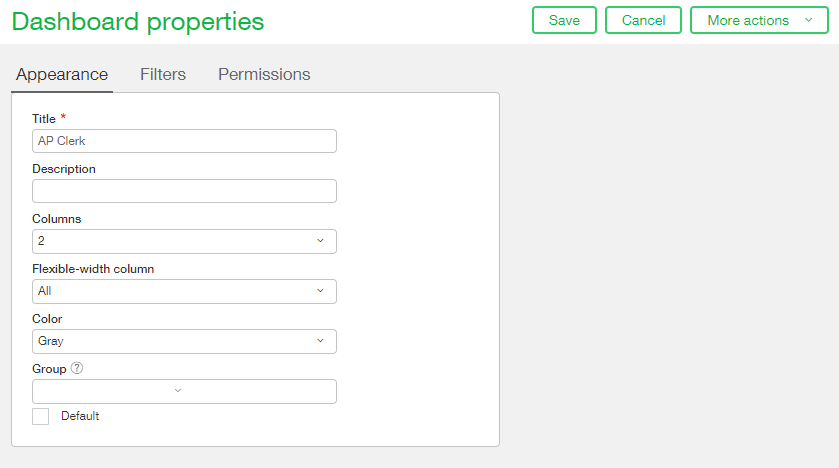
Now that we’ve learned about what dashboards are and what type of components are available to be placed on dashboards, let’s make a dashboard! New dashboards can be added to your instance of Sage Intacct by navigating to Dashboards > All > Dashboards > Add. The first tab you will be greeted with is the Appearance tab where you will specify details such as Title, Description, Columns, Flexible-width columns, Color and Group. We will be creating a dashboard for our AP Clerk which is inferred by the name. In large organizations it’s important to plan the dashboard naming in such a way as to allow for growth while still using names that make sense. Don’t worry though, the dashboard title can be changed after it has elements on it!
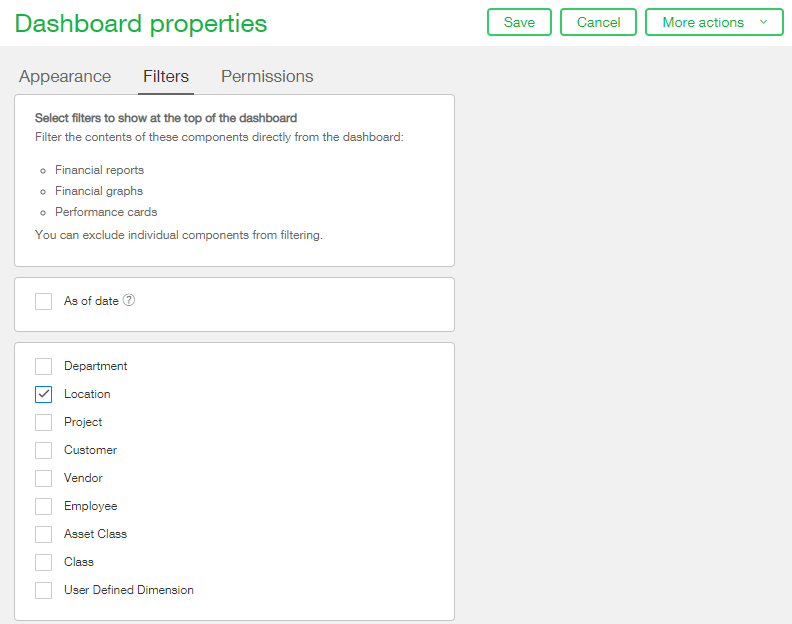
The Filter tab is where you can select which filter options you wish to show at the top of the dashboard. The filtering of the dashboard will apply to performance cards, financial reports and financial graphs. Unsure if you need this option? Feel free to add one or more dimensions and try them out. If it turns out you don’t use them you can always edit your dashboard later to remove them. The ‘As of date’ is an optional field you can add to the top of your dashboard for increased flexibility in searching. This field allows you to reference previous periods on dashboard components. In our example we will add a dimension filter for the Location dimension to our dashboard.
Please note: Dashboard filters set to allow will over-ride filters that were set when building the report.
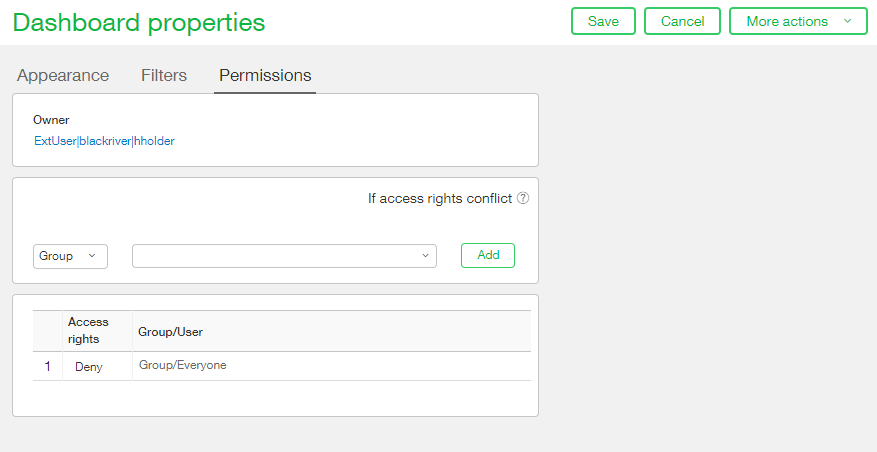
The Permissions tab is used to specify who you wish to give access to your new dashboard. By default all new dashboards will be set to be hidden from everyone except the dashboard owner and Administrators. This can be noted by the first line which stated Deny Group/Everyone.
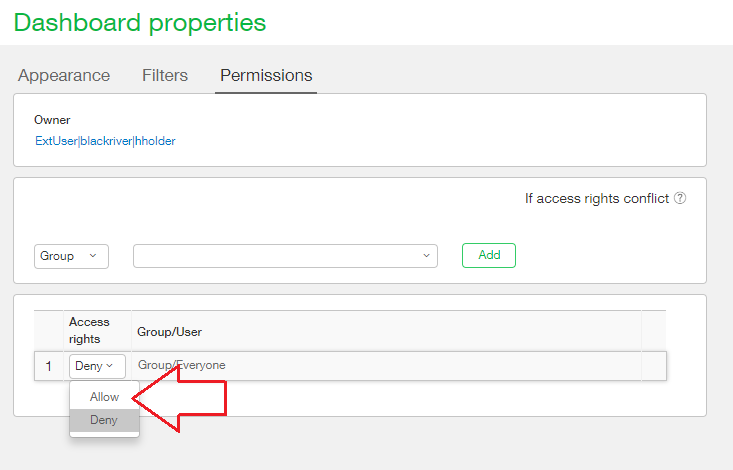
It is generally recommended that dashboards be kept with the default permissions during the creation process. Once the dashboard components are applied to the dashboard and the owner is satisfied with how the dashboard looks, that is when it’s recommended to ‘go live’ with the dashboard, if desired. The dashboard visibility can be set to everyone very easily by simply clicking the word ‘Deny’ in the access rights line and changing it to ‘Allow’.
No every instance dictates having all dashboards visible to everyone. Perhaps you are one of two AP Clerks and you wish to only allow you and the other clerk to view this dashboard. This can be accomplished by denying access to Group/Everyone but allowing access to the other clerk, bporter, as shown in our case below.
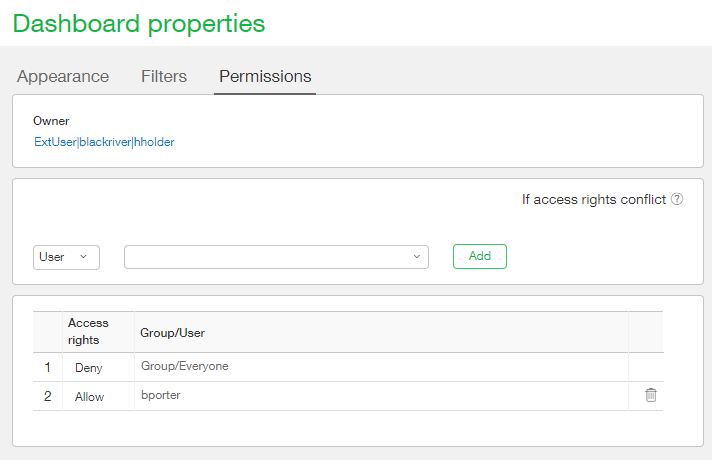
Permission line items can be removed by clicking the delete icon (garbage can) next to the line item you wish to remove. You may notice that there is no ability to delete line one as it is imperative that a permission be set for the group ‘Everyone’.
Generally speaking, the person who creates the dashboard is the one who is able to allow/remove visibility permissions to their dashboard. That said, a user with Administrator permissions can access dashboard settings for dashboards that they are not the owner of. This is very useful in the case that the employee who created a dashboard is no longer with the company and the company wishes to give their replacement access to it. When logged in as an Administrator the Owner field is a dropdown as shown below.
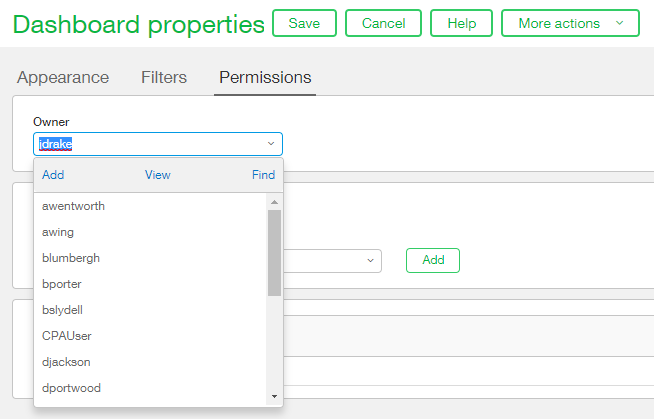
Dashboard permissions can be set or change at anytime; for example after the dashboard components are added. For our new dashboard we will stick with the default settings of denying visibility to Group/Everyone. Click Save to create and save your new dashboard.
Note: Regardless of the permissions set in the Dashboard Properties the user viewing the dashboard must have access to the data being queried in order to view that data.
Join us next week as we add components to our new dashboard.