The KPIs on Dashboard Reports should be a mix of financial and non-financial indicators, which means that data from outside of the financial system is leveraged with financial data to provide a more insightful perspective of performance. This would include information about volumes, pricing, shipments, utilization, etc. Most organizations find they are able to identify 8-10 key performance indicators that really drive performance and these become the metrics that populate the dashboard.
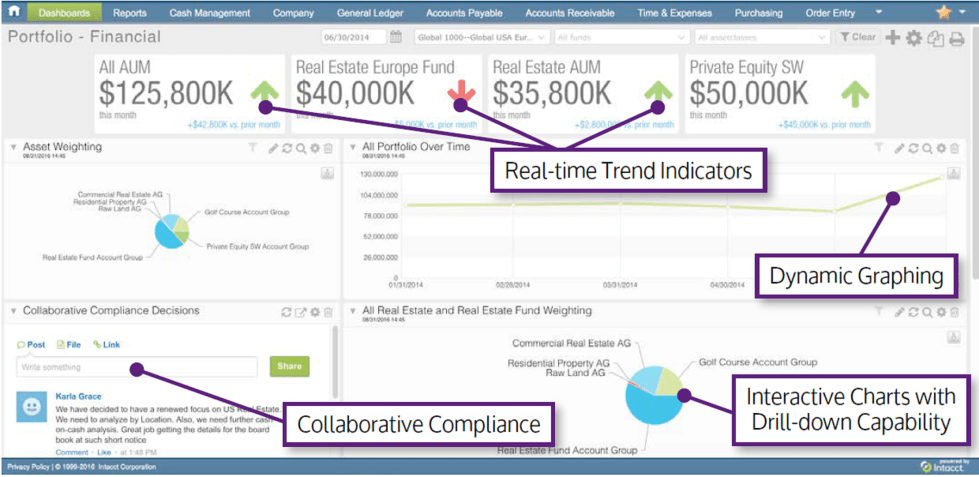
Modern dashboards are interactive for the user and add more value than a static printed report. The true insight comes from a user’s ability to drill into the various metrics on their screen and interact with the underlying data. This data can be sorted, spliced, and drilled further, all the way back to the transactional level, to give users a deeper and richer understanding of the underlying cause and effect of what has happened.
Dashboards should drive management action and decision-making. When indicators fall outside an acceptable tolerance range, dashboard indicators should make these deviations obvious to the user.
Dashboards that incorporate color scaling, trend indicators, conditional highlighting, and spark lines help focus attention on areas for a user to drill deeper and develop insight. When the reports are converted from a static state to a dynamic state, users have a tool at their fingertips to ask and answer their own questions.
The role of finance is to ensure that the data included on a dashboard has integrity and that the right metrics are presented. The adoption of enabling technologies enhances reporting integrity by maintaining the live connection to the underlying sources of data alleviating finance people of this time-consuming activity. As a result, these types of technology change the role of how finance people are deployed.
Finance resources spend less time gathering, reconciling, aggregating, and cleansing data. Their contribution is upgraded and now begins emphasizing the review of data to identify errors, the analysis of data to uncover insights, and establishing KPIs that measure and communicate performance. These are all value-added activities that draw on experience and business expertise, less so on base data manipulation and validation technical skills.
Well-designed and implemented dashboards give you the best possible control over financial processes. Dashboards are user defined, easily tailored, drill-down enabled, and visually direct attention to the important KPIs of the business.
Are your IT and finance resources buried in ad hoc analysis? Is it a challenge to have strong, decision-relevant information at your finger tips to manage the business with confidence? Then, evaluating your own reporting systems is your next step.